Live Electoral Analysis (2012-11-06 22:19 PDT) @T-0d
Cody Stumpo and Daniel Reeves
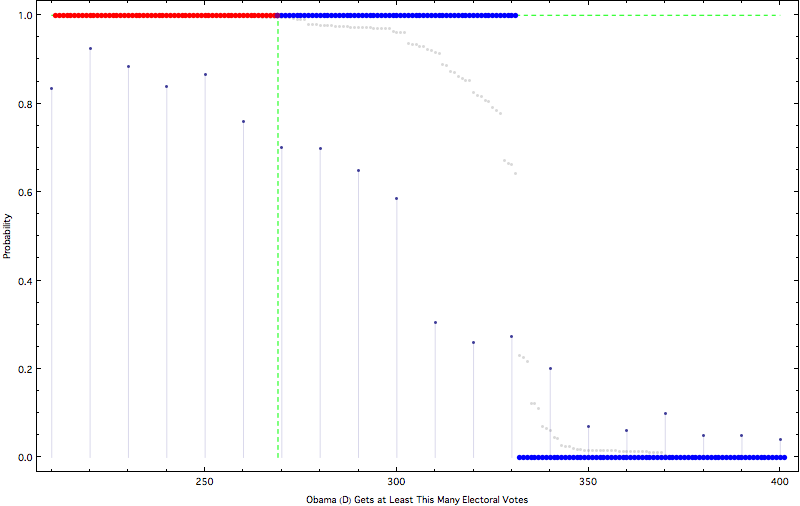
The red/blue points give the probability distribution for number of Obama electoral votes.
The green dashed crosshairs give the probability of an Obama win.
The bar chart gives the current probabilities according to the electoral vote count markets on Intrade.
The gray points give the probability distribution under the assumption of perfect independence between states.
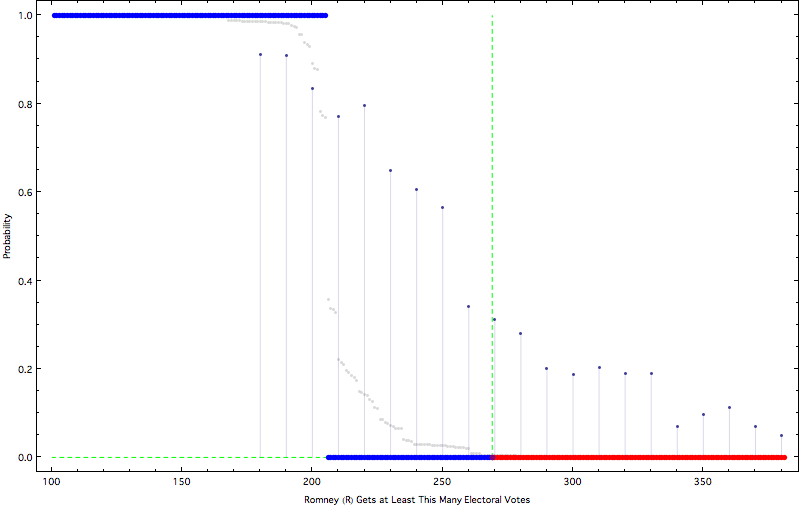
Same as above but from Romney's perspective.
Current Romney and Obama intrade prices: 0.3 & 99.4 (renormalized: 0.3 & 99.7)

Estimates of Obama's win probability:
  Based on simulations (and giving the 0 probability of a 269-269 tie to Romney): 1
  Assuming perfect correlation between states: 0.952245
  Assuming perfect independence between states: 0.9955
Estimates of the number of Romney & Obama electoral votes:
  Expectation (mean of simulated distribution): 206 & 332
  Most frequently simulated outcome (mode of simulated distribution): 204 & 332
  Max likelihood estimate ("leaning" towards Romney & Obama): 206 & 332
  Expectation under the assumption of perfect independence betw states: 209.745 & 328.255
Methodology
-
Determine covariance matrix of 51 pairs of state electoral markets on
intrade, based on 90-day window of daily price movements.
- Simulate Gaussian Copula of price movements per day, for as many
days as remain to the election.
- Award each state's electoral votes according to ending price,
assuming limited fallibility of intrade prediction and independence of
prediction error:
price < 0.3 : defeat,
0.3 < price < 0.7 : victory assigned
with probability = price,
price > 0.7 : victory.
- Repeat simulation 4000 times and gather statistics.
The following table shows electoral votes by state, current intrade prices, and percentage of simulations in which Obama won each state.
States colored red (or purple) are the most likely set of states sufficient for a Romney win.
Similarly for states colored blue. Probabilities/prices are colored according to which candidate they favor.
| (Easiest way for Romney to win is to win these states...) |
(Easiest way for Obama to win is to win these states...) |
| EV | D-Price | R-Price |
D+R | R/(D+R) | % R win |
|---|
| WA | 12 |
99.7 | 5. | 104.7 | 4.8 | 0. |
| IL | 20 |
97. | 5. | 102. | 4.9 | 0. |
| NY | 29 |
95. | 5. | 100. | 5 | 0. |
| ME | 4 |
97.9 | 20. | 117.9 | 17 | 0. |
| AK | 3 |
10. | 94. | 104. | 90.4 | 100. |
| SD | 3 |
5. | 94. | 99. | 94.9 | 100. |
| ND | 3 |
4.5 | 99. | 103.5 | 95.7 | 100. |
| UT | 6 |
4. | 93.6 | 97.6 | 95.9 | 100. |
| MS | 6 |
3. | 90. | 93. | 96.8 | 100. |
| TN | 11 |
2. | 90. | 92. | 97.8 | 100. |
| WV | 5 |
2. | 93. | 95. | 97.9 | 100. |
| TX | 38 |
2. | 99. | 101. | 98 | 100. |
| SC | 9 |
1.5 | 98. | 99.5 | 98.5 | 100. |
| MT | 3 |
1. | 99. | 100. | 99 | 100. |
| IN | 11 |
0.6 | 97.5 | 98.1 | 99.4 | 100. |
| WY | 3 |
0.2 | 86.1 | 86.3 | 99.8 | 100. |
| KY | 8 |
0.1 | 96. | 96.1 | 99.9 | 100. |
| OK | 7 |
0.1 | 97. | 97.1 | 99.9 | 100. |
| MO | 10 |
0.1 | 98. | 98.1 | 99.9 | 100. |
| GA | 16 |
0.1 | 98.9 | 99. | 99.9 | 100. |
| NC | 15 |
0.1 | 99.8 | 99.9 | 99.9 | 100. |
| AZ | 11 |
0.1 | 99.9 | 100. | 99.9 | 100. |
| ID | 4 |
0 | 93.5 | 93.5 | 100 | 100. |
| AL | 9 |
0 | 99.5 | 99.5 | 100 | 100. |
| AR | 6 |
0 | 97.5 | 97.5 | 100 | 100. |
| KS | 6 |
0 | 96.4 | 96.4 | 100 | 100. |
| LA | 8 |
0 | 81. | 81. | 100 | 100. |
| NE | 5 |
0 | 82.9 | 82.9 | 100 | 100. |
|
| EV | D-Price | R-Price |
D+R | D/(D+R) | % D win |
|---|
| WA | 12 |
99.7 | 5. | 104.7 | 95.2 | 100. |
| HI | 4 |
97.5 | 3. | 100.5 | 97 | 100. |
| CA | 55 |
98.5 | 2. | 100.5 | 98 | 100. |
| CT | 7 |
99. | 2. | 101. | 98 | 100. |
| OH | 18 |
99.6 | 2. | 101.6 | 98 | 100. |
| NM | 5 |
98.9 | 1.5 | 100.4 | 98.5 | 100. |
| DC | 3 |
97.5 | 1. | 98.5 | 99 | 100. |
| VT | 3 |
98. | 0.5 | 98.5 | 99.5 | 100. |
| WI | 10 |
99.5 | 0.5 | 100. | 99.5 | 100. |
| IA | 6 |
95.1 | 0.3 | 95.4 | 99.7 | 100. |
| MA | 11 |
99.5 | 0.3 | 99.8 | 99.7 | 100. |
| FL | 29 |
99.7 | 0.3 | 100. | 99.7 | 100. |
| MI | 16 |
95. | 0.2 | 95.2 | 99.8 | 100. |
| NJ | 14 |
97.9 | 0.1 | 98. | 99.9 | 100. |
| NV | 6 |
99. | 0.1 | 99.1 | 99.9 | 100. |
| NH | 4 |
99.2 | 0.1 | 99.3 | 99.9 | 100. |
| OR | 7 |
99.4 | 0.1 | 99.5 | 99.9 | 100. |
| PA | 20 |
99.5 | 0.1 | 99.6 | 99.9 | 100. |
| VA | 13 |
99.6 | 0.1 | 99.7 | 99.9 | 100. |
| CO | 9 |
99.9 | 0.1 | 100. | 99.9 | 100. |
| MN | 10 |
99.9 | 0.1 | 100. | 99.9 | 100. |
| DE | 3 |
96. | 0 | 96. | 100 | 100. |
| MD | 10 |
94. | 0 | 94. | 100 | 100. |
| RI | 4 |
95. | 0 | 95. | 100 | 100. |
|
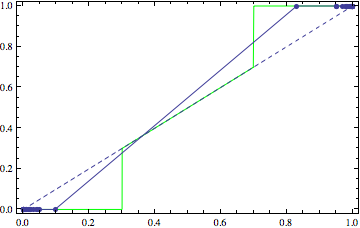
Given current intrade price (x axis) and the price history (across 51 electoral markets), what is the chance (y axis) that the price on election day will be above 50?
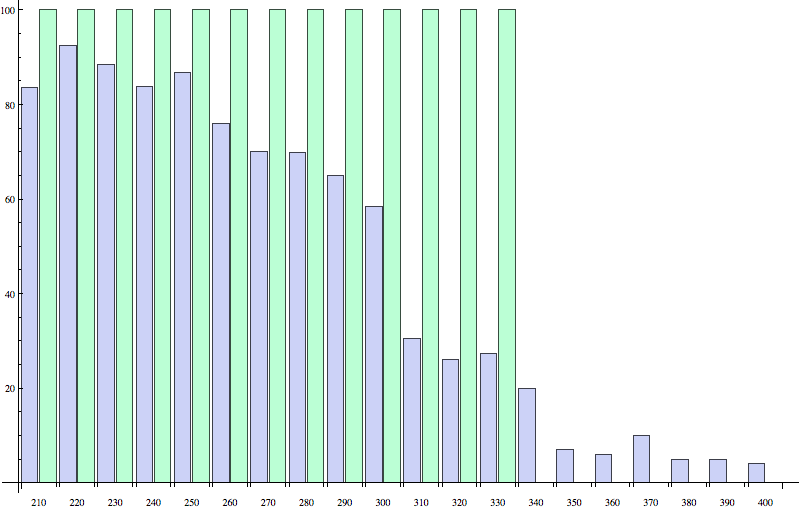
What is the simulated chance Obama will win x or more electoral
votes (green) and what is the Intrade contract price on the same
question (blue)
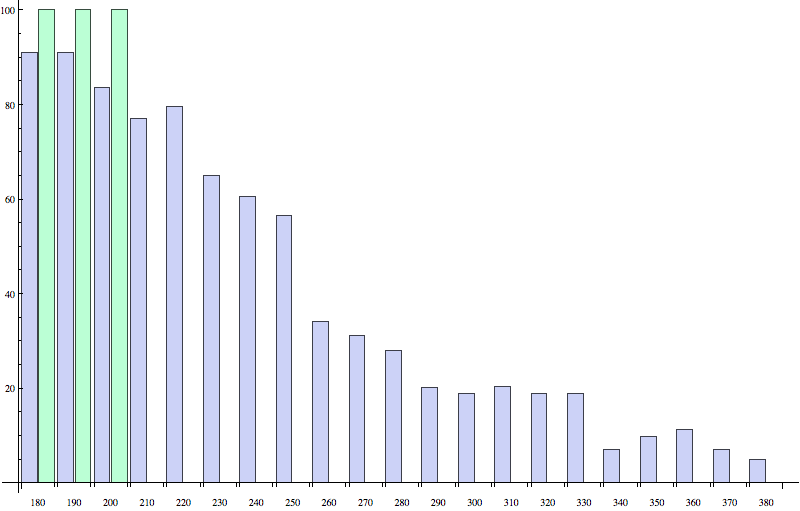
What is the simulated chance Romney will win x or more electoral votes (green) and what is the Intrade contract price on the same question (blue)
This page was generated in Mathematica at 2012-11-06 22:19 PDT